Sunday, February 26, 2023

User Experience: Land Planning / Forestry

The iMapit app has been a godsend for my forestry project.

In the spring of 2021, I began stewarding a 28 acre forest in eastern Washington state.  Initially, the land was totally unknown to me and barely accessible.  It had no buildings or any human development.  No access off the road, no water, no electricity, poor internet.  My plan has been to make the place habitable and to reduce the danger of wildfire by trimming the pine trees and removing the bitterbrush undergrowth.  Eventually, I want to plant a food forest and to practice permaculture on the land.

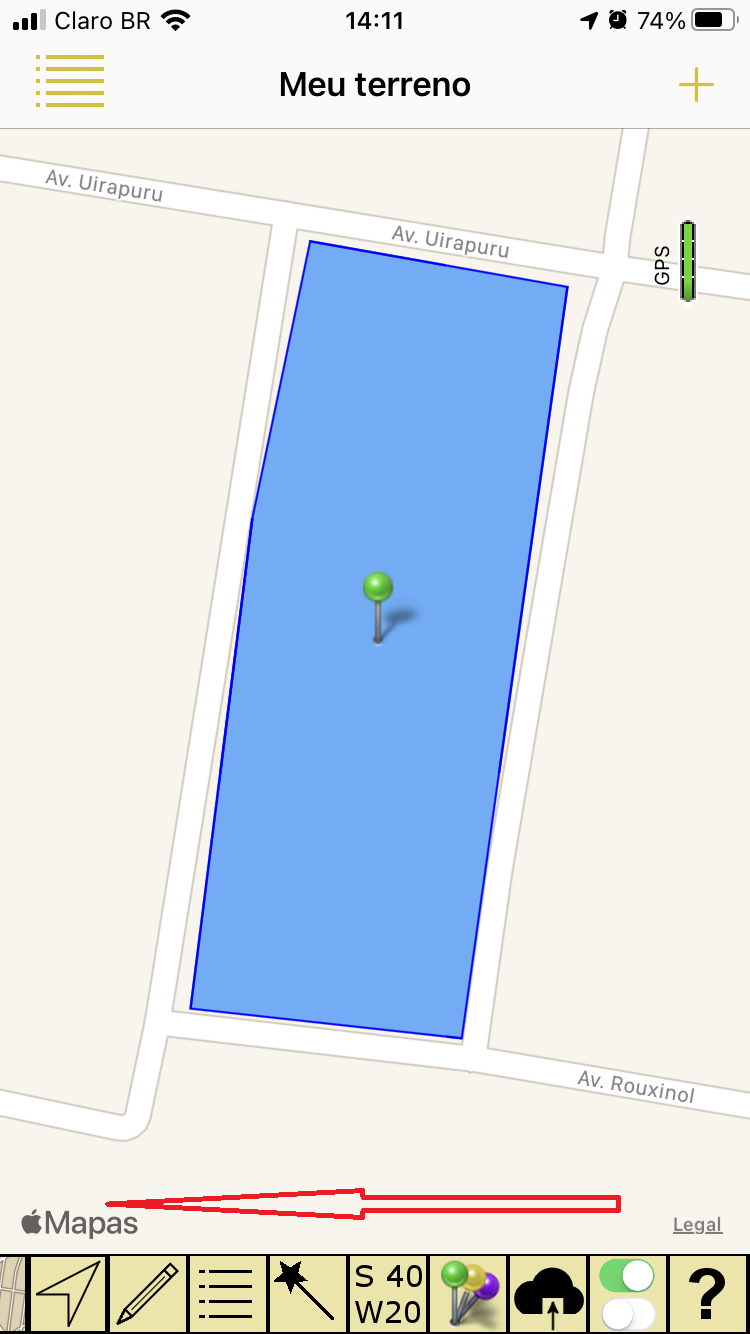
In order to consciously steward the land, I had to learn to find my way around it and to develop tools to collect and store the information that I gained.  This is where the app was so useful in conjunction with Google Earth (GE).  My first step before I even arrived on the land was to find it on GE and to collect all the information that I could through the internet.  I drew the property boundaries and established a grid system of cells 200 feet on a side – 28 cells in all – identified by letters and numbers (A to E from west to east and 1 to 6 north to south) producing a unique label for each cell (A1, A2,… F6).  See figure 1.

Figure 1a


Figure 1b

From GE I was able to determine the coordinates for each cell corner and when I arrived on the land I used iMapit to find the coordinates on the ground where I would put a stake with the cell identifier.  The brush was thick enough that it was initially difficult to find the stakes after I put them in so I wrapped them in bright surveyor tape and used iMapit to find the coordinates.  Without internet, I could not use GE software on-site so iMapit was my tool in the field.  

Once I had the coordinate system in place, it became much easier to navigate around on the land and I began the fire hazard reduction work.  I was approved for governmental matching funds for this work which meant that I needed to assure that I treated every tree in the project plot (initially eleven acres).  A side benefit of careful documentation is that I could actually inventory the trees and determine how much timber is on the property.  This information will eventually be important in developing a forest management plan.  So, every time that I treated a tree I would label it with the cell number and tree number (A1-1, A1-2, etc.) and I would measure the girth, the height and the breast high circumference.  Then I would use iMapit to mark the coordinates by dropping a pin in the app.  At the end of the day, I would enter the coordinates for each tree with its data into GE with a pin for each tree.  See figure 2. 

Figure 2


Now, by the end of my second summer, I have the eleven acres finished and around 200 trees mapped in GE.

I have also used iMapit to gather other information about the property and to assist me in laying out berms, swales, trails, camping sites, and where I am planting fruit and nut trees.  See figure 3. 

Figure 3a

Figure 3b


I’ve used it to keep track of wildlife habitat piles I have built and interesting features I discover on the land.  Always, iMapit has been my tool on my cell phone in the field and GE has been the tool on my computer for adding the information as I collect it.  I have been very grateful for the support that I have received from Marcus as I had difficulty initially importing the data electronically from the app to GE.  Marcus helped figure out that the issue had to do with my email program and with some special characters I was using in my data collection.  He helped clean up my data so I could import it easily.

Article by: Steve / Washington

Monday, April 12, 2021

How to Export Your Projects

 The iMapIt Pro version has a specific screen so that you can use all the export options available and share your surveys for use on other computers and software. These are quick instructions to make exporting your project easier.

 1) The Project to be exported is the project you are currently viewing on the Map Screen. If you want to select another project just select it and leave it active. The "Map Screen" article can give you more information about its use.

 2) Please note that depending on the size of your device's screen, the button bar at the bottom of the map screen is a sliding bar. If you run it to the left you will find new features.


3) The button that opens the Export screen is this one:


4) Tapping on this button will show the Export Project screen with all its options


The options:


File Format:

  • DXF - This is the export format defined by AutoCad for exchanging data between different programs. Several drawing programs import this format;
  • KML - This is the format used by Google Earth as well as Google Maps. Exporting with this format will allow you to open your maps in one of these utilities;
  • GPX - This is another format for exchanging data collected by GPS, and used by another large set of programs;
  • CSV - This is a format for importing in spreadsheet programs. Most spreadsheet programs on the market like Excel and Open Calc open this format. This is the only one of the export formats that does not open a map. It will open a list of all the surveys done on your project with their respective comments and coordinates.


Coordinate Systems:

 Coordinate systems define how you will export the coordinates collected in your surveys. Originally, coordinates are collected in latitude and longitude, in degrees. iMapIt offers two other coordinate projection formats, where latitude and longitude are converted to a numerical value, in meters, that works well for smaller locations and that are not influenced by the curvature of the earth. I would say a few thousand kilometers.

The projections are:

  • Geographic - It is the original coordinate system, in degrees, that defines latitude and longitude;
  • UTM - It stands for Universal Transverse Mercator, and it’s used in many countries to make local measurements;
  • Gauss Krüger - It is a coordinate projection very similar to the UTM, used more frequently in Europe, but which presents a small displacement when compared to it;

If you already have a map in some other software and you will use this iMapIt survey to complement it, try to find out which projection is being used in this map, so that the exported projection will match it.

You will notice that whenever you change the file format, a different coordinate system will automatically be selected. This is because these predefined coordinate systems work better, or are used more often, with these file formats. However, nothing prevents you from changing it anyway.

Also note that just below the selection of the Coordinate System there is an Ellipsoid indication and a button that allows it to be changed. This option is only available for the UTM projection and will define the ellipsoid that should be used as a reference for the conversion.


Axis Distribution

 This is an option you will not need to change, in any case, to obtain a map according to the format and projections previously defined. As you change the file format it is automatically selected for you.

However, as the option exists, you can to change it. The consequence of this is that the projection’s X and Y axes, or latitude and longitude, are exchanged, changing the orientation of your map. We recommend that you change it only if you have a specific goal.


Project Text

This option allows the list of coordinates to be added to the explanatory text for each survey carried out in the project and exported. This option is only available for the KML and GPX file formats.


File Destination

This option indicates how the exported file will be extracted from your device.

  • USB - When connecting your device to your computer, you will have the exported file available for copying;
  • eMail - Allows you to send the exported file by email. A new screen for sending e-mails will open with the standard Apple e-mail utility;
  • Web - This is a more professional export format. You can define a web server at your office with an address ready to receive these types of files and save it to your server computer. For using this feature you will need to prepare a specific web page to receive it. We have an article that will help you define this web page to receive the file here and here.

All the additional information in this section concerns exporting via Web, and they will be enabled when this option is active. The options are:

  • Device Identification - This is a number that uniquely defines your iPhone or iPad. It can be used to identify who sent the file and can be used to guarantee the security of your website, restricting unknown accesses;
  • "Recently Used Internet Addresses" button - Allows you to select one of the last used internet addresses;
  • "Internet Address" field - Allows you to enter the internet address to which your export will be made;

Again, depending on the size of your screen, you may need to scroll down to see the remaining options.


File name:

 This field defines the name of the file to be exported and allows you to change it. We recommend that you do not change the file name extension. In the above example, the extension is ".kml". The extension is changed automatically according to the defined file format.


Export

 This button effectively exports your project, with all the options selected, and sends the file to the chosen destination.

 The project is always exported entirely.

As of iMapIt Pro version 4, there is an option, among the editing options, that allows a survey, or feature, to be moved to another project. This can be useful if you want to export only a part of the project.

Sunday, March 28, 2021

iMapIt V4 - Features and Comparison Between Versions

 Below is a table with the features of iMapIt and the comparison between the Pro and Lite versions.


iMapIt FeaturesPROLITE
Available to:  
   iPhonexx
   iPadxx
View schematic mapxx
View map with satellite imagexx
Allows you to rotate the map following the direction of displacementxx
Allows you to lock the map in an orientationxx
Uses maximum device GPS accuracyxx
Allow creating multiple projectsxx
Wizard to guide the use of the applicationxx
Collect Pointsxx
Collect Linesxx
Collect Polygonsxx
Manual Surveyingxx
Automatic Time Surveyingxx
Automatic Surveying by Distancexx
Automatic Surveying by Directionxx
Allows you to temporarily pause automatic surveyingsxx
Calculates lines extensionx1
Calculates polygons areax1
Available space to describe the projectxx
Available space to describe each surveyxx
Measurements in metric unitsx1
Measurements in imperial unitsx1
Measurements in Thai unitsx1
Shows GPS precision while collecting pointsxx
Shows coordinates in real timexx
Allows you to change colors for fills, lines and pinsxx
Allows you to define new color categories for fills and linesxx
General application settings:  
   Turn sounds on / off during surveyingxx
   Change the transparency of the MapIt buttonxx
   Change color defaults for points, lines and polygonsxx
   Display / Hide length and position of surveyed archesxx
   Change default units of area and lengthxx
   Configure automatic collection typesxx
Exporting features:  
   Exported file formats:  
      Exports file in DXF formatx 
      Exports file in KML formatx 
      Exports file in GPX formatx 
      Exports file in CSV formatx 
   Allows extracting exported file through USBx 
   Sends exported file through e-mailx 
   Transfer exported file to prepared websitex 
   Projections of exported coordinates:  
      Geographical coordinatesx 
      UTM Projectionx 
      Gauss Krüger Projectionx 
   Alternates coordinates between aixes X and Y in exported filex 
   Allows to define the exported file namex 
   
1 - Feature available only once  
   
The Pro and Lite versions published at this time are separate applications and do not allow data sharing between them. That is, if you download, test and like the Lite version, which is free, and you want to purchase the Pro version to enjoy the additional features, you will not be able to migrate the measurements from one version to another. You will have to survey them again in the Pro version. 

Wednesday, November 11, 2020

iMapIt V4 - Map Screen - General Information

 General information about the map screen.


General concept


The iMapIt structures the collected information as follows:


Projects  Surveys  Surveys attributes and coordinates


Surveys are also called features.


A project is a set of surveys with a specific meaning. A ranch, for example. At the place you can make a series of surveys such as the path for getting there, the outline of the entire property, the outline of the house, the line defining the place of a fence you want to build, location of specific trees that you have found, etc. All will be measured for you. The outline of the property or house can be created as a closed polygon, so that you have its area. The path can be created as a line, so you will have its length. The trees you want to mark can be collected as points, which can be groups of points or just one of them. Polygons, lines and points can be differentiated with different fills, outlines, colors and types of pins, to facilitate their visualization and interpretation.


You can also export your project. The project is exported in its entirety. The file formats are compatible with many known software and will be described later.


Conceptually iMapIt uses the iPhone’s or iPad’s GPS to collect your position and save that coordinate in a feature. This is the only way to add points to a feature: in the field. Preferably without a roof. The GPS uses the visibility of some in orbit satellites to locate your position. The more satellites are visible, the better the accuracy of your surveys. On our blog there are specific articles on the survey’s accuracy with the iPhone.


The map screen


This is the main iMapIt screen.


It is the starting point for all application controls.

We will briefly describe the function of each button below.


Starting by the top: 


Creates a new project;


Lists all already created projects and allows you to alternate between them;


The bottom part:


Depending on the size of your device, the button bar is scrollable, that is, you can scroll left to see the other buttons.


The functionality embedded in each button is as follows:


Tap on it to start the procedure to collecting coordinates.


Set of buttons to select the survey type


Each time you tap on one of them you switch the survey type to the next one, until you find the one you want to use.


Manual measurement - A coordinate will be collected when you tap the MapIt button. And only when you tap on it. The MapIt button only appears when you start the survey;


Automatic Survey by Time - The coordinates will be collected at a time interval measured in seconds. This interval in seconds can be changed on the settings screen;


Automatic Survey by Distance - The coordinates will be collected at each distance interval covered, in the defined standard unit (feet, meters, etc.). This distance range, as well as the standard units for areas and lengths, are defined in the settings screen;


Automatic Survey by Direction - When you are moving you may be walking in a straight line or start making some small changes in direction. There is an angle defined in the settings screen that defines the tolerance limit that iMapIt waits, from your movement curve, to collect a new coordinate. Initially the defined angle is 1o 30’ (one degree and thirty minutes, or one and a half degrees). Every time you change the direction of your displacement by more than 1o 30’ iMapIt will collect a new coordinate;


Automatic collections were created so that you can collect coordinates while you are on the move, without having to keep tapping the MapIt button. It works better while you are on the move. If you interrupt your displacement we suggest you to also interrupt the coordination collection by tapping on the Pause button, to avoid collecting unwanted coordinates. Even while you are collecting coordinates automatically, the MapIt button will be available for you to collect an additional coordinate if you want.


Set of buttons to select the feature type

These buttons define what feature type, or shape, you are going to collect.

Each time you tap on one of them you switch the feature type to the next one, until you find what you want to use.


To collect isolated points;


To collect lines, or concatenated points;


To collect areas, or closed polygons;


Set of buttons to select the map orientation 

These buttons define whether the map is static or rotating to follow your movement.

Each time you click on one of them you switch the orientation type to the next one, until you find which you want to use.


Map locked. The map will always be fixed, with its top facing north, unless you rotate it with your own fingers;


Rotating map. The map will always point to the direction you are moving. The map rotates automatically.


Set of buttons to select the map view

These buttons define whether the map shown is schematic, that is, a drawn representation of the geographic layout around you, or whether satellite photos of your region are displayed.

Each time you click on one of them you switch the map view to the next type, until you find what you want to use.


Schematic map;


Map with satellite photos;


Set of buttons to alternate location view

These buttons define whether you will see all of your measurements at once on the map, or whether the map will be centered where you are currently positioned.


Your location. As you move, your location is centered on the map;


Display of all collected measurements.


Other buttons 


Opens the screen that allows changing the project name and description;


Opens the screen that lists all surveys already collected in this project;


Opens the iMapIt usage wizard;


Displays your current position’s coordinates and accuracy at the top of the map screen;


Displays the category definition screen. You can create new hatches, types and colors of lines and points to use in your measurements;


Opens the screen that allows you to export your project;


Opens the settings screen;


Opens this help screen;


For additional information


If you need further information you can visit our blog where you will find a number of articles and videos on the iMapIt.


https://imapitsupport.blogspot.com


http://youtu.be/zKJWJLROpHA


Or you can send an email to:


contact@imapitapp.com.br


Saturday, October 24, 2020

Clean Unnecessary Points - New Feature

 This article was written to describe a new feature that will be included in the release of iMapIt`s version 4, to illustrate it and bring understanding of its use.

“Clean” is a quick way to purge unnecessary parts of a mapping measurement. When we collected a large number of points and we would not necessarily need all those points, we can clean them automatically.

Observe, for example, the measurement shown in the image below, of an approximately rectangular area, where we had collected a coordinate for each of the small blue dots highlighted.


Note that there are several points that apparently are part of the same line shape. In the example above there are only a few points. But imagine measurements with hundreds or even thousands of points and where many of them could be removed without prejudice to the contour of the area. We would save a lot of space not only on our equipment, iPhones and iPads, but also transfer time and further processing time if we were to take these measurements into other software.

What if we could have a quick way to remove these “unnecessary points”, obtaining a measurement with the same contour and with fewer points, as shown in the figure below?


This is the goal of this new function called “Clearing Unnecessary Points”. In version 4 of iMapIt it will appear among the many other new functions available for handling a feature shape.


And how does this new function work?

Setup:

In this new version, a new option for automatically collecting coordinates was introduced, which collects a new point with each change of direction in your displacement. This type of automatic collection due to changes in the movement direction introduced a new parameter: an angle of inclination. This angle defines the limit that iMapIt can accept between the previous line segment collected and the new one that is about to be created while you are moving. A new coordinate will be collected when this angle is reached.

This angle is defined in the settings screen and can be changed at any time as needed. The image below presents this new functionality in the settings screen.


The “Clean” function uses this same angle to do its job. Above we see the standard angle that is initially defined: 1o30’ 0” (one degree and thirty minutes) of inclination.

Its logic:

Note that each feature is made up of a sequence of points. When the feature is of the “Point” type, the collected points are presented individually. When the feature is of the “Line” type, the points are concatenated in the sequence in which they were collected, so that they form a line. And finally when the feature is of the “Polygon” type, just like the “Line” type, the points are concatenated in the sequence in which they were collected, so that they form a line, but the last point is automatically joined to the first so as its shape becomes a closed polygon, which defines an area.

Also note that for the “Line” and “Polygon” feature types, each line that forms its outline is formed by a sequence of straight lines segments. Each line formed by two consecutive points. These line segments form angles to each other, as shown in the figure below.


The “Clean” function eliminates points that are between two lines that form an angle smaller than 1o 30’, or any other angle that is defined. Thus, the feature will have fewer points to represent a shape very similar to the previous one.


Before


After

This function does not change the original feature. It creates a new feature where the “unnecessary points” have been eliminated. If you are satisfied with the result and no longer need the original feature, you can simply delete it.


Friday, October 23, 2020

iMapIt version 4 – New Features

We have a new version of the iMapIt app in the oven and almost ready to be published on the AppStore. It is expected to be published in mid-December. It is version 4. For those who already have a previous version, this will be just an update.


However, this version brings a significant number of improvements and the purpose of this article is to present them succinctly.


Improved map display while measurements are being collected

In previous versions the map always had a fixed orientation, oriented to the north, unless you explicitly place two fingers on it and rotate it.

In the new version there is a new feature that rotates the map according to the orientation of your device. If your iPhone / iPad is pointing south, the map is oriented to the south. If the device is pointing to the east, the map is oriented to the east. It will always follow your movement.

When this feature is turned on, the possibility of viewing the map in 3D is also available, so that you feel inside the place where you are traveling.


Automatic coordinate collection feature added

In previous versions, when taking a measurement, you always had to touch the “MapIt” button to collect the coordinate at the place where you were. This way of collecting coordinates continues to exist and is now called “Manual Collection”.

From this new version, three new ways of collecting coordinates fully automatically were added, that is, you do not need to touch the “MapIt” button to collect the coordinates.

·      Collection by Time – A new coordinate is collected at each time interval, defined in seconds;

·      Collection by Distance – A new coordinate is collected at each interval covered by a certain defined distance, according to the standard unit defined in the App, which can be meters, inches, yards, etc. If the collection distance is set to 5 meters, a new coordinate will be collected every 5 meters from your displacement;

·      Collection by Direction – A new coordinate is collected each time you change the horizontal angle of your displacement, that is, each time you change direction. This angle is defined in degrees, minutes and seconds;


Automatic collection assumes that you will be on the move. Not necessarily at constant speed, but always in motion. This information is important because the varying accuracy of the iPhone / iPad GPS can cause unwanted coordinates to be collected, even when you are standing still.

To assist in this possible pause in your movement, a new button was included, just below the “MapIt” button that will allow the collection to be paused for later resumption. This button will also show you how your displacement is changing so that you have an approximate notion of the time of the next coordinate collection in elapsed time, distance traveled or angulation of your displacement in relation to your last direction.

Automatic collection continues to work even if your device is off, locked.


The wizard functionality, which helps you choose the options to perform your measurements, has been expanded to include automatic collections.


A set of functions to edit features were added

The screen showing the details of a feature / measurement has been completely rebuild.

Now your feature map can be expanded for a better view of your details and for easier manipulation. When the map is expanded small points are presented where each coordinate was collected, for the line and polygon feature types.


The information presented in the previous version remains:

·      The type of feature design (category), that is, the type of the pin, the color of the line and the filling of the polygon, which can be changed;

·      Creation date;

·      Its dimension - length for lines and area for polygons;

·      Its perimeter - for polygons;

·      Display the dimension on all other units supported by iMapIt;

·      Display of the list of coordinates;

·      It is still possible to edit the name of the measurement and add a descriptive / explanatory text about it;

·      Turn on or off the display of the length of each line segment, for lines and polygons;


Feature statistical information has been added:

·      Number of coordinates collected;

·      Its minimum, average and maximum horizontal and vertical accuracy;

·      The altitude variation, also minimum, average and maximum;

·      The range of latitude and longitude covered, minimum and maximum;


New functions have been added to will allow modifying, or editing, features. Remember that coordinates are only added through collection at their physical location, by definition. The functions described below allow all types of modifications to be made to a feature.

·      Clear Unnecessary Points - This function eliminates points that form the same line and that can be removed from the feature without affecting its shape. There will be a separate article to describe this function;

·      Duplicate Feature;

·      Join Features - Join two or more features to create a new one;

·      Split the Feature in Two;

·      Delete selected coordinates;

·      Move Feature to Another Project;


All of the above functions create a new feature with the changes implemented. They never directly alter the original feature to prevent you from unduly losing any information from your measurements.

The functions for Clearing Unnecessary Points and for Duplicating Features will run in the background. For features with a reduced number of coordinates, these functions will execute very quickly, and will practically have finished when the message informing the name of the new feature is presented. However, with the automatic coordinate collections new feature, the tendency is for the features to grow a lot in the number of coordinates collected. For this reason, these functions can continue to work even after the name of the new feature has been informed.


The new function that deserves a special mention for it is the one that brings the possibility of changing the type of the feature. In other words, if you have collected isolated points, but instead you wanted a line or a polygon, just enter the feature screen and change its type. Its map representation it’s changed automatically to become the representation of the new feature type. You will no longer need to go to the field to take a new measurement.


In this way we hope to make the experience of using iMapIt much more useful.

We hope you enjoy.